Detecting Resonance
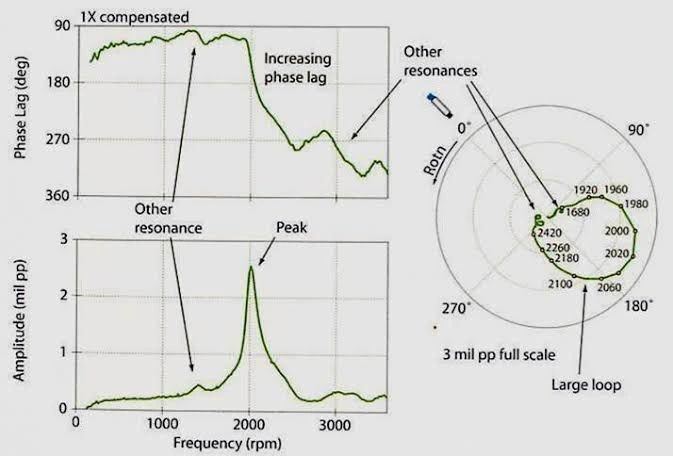
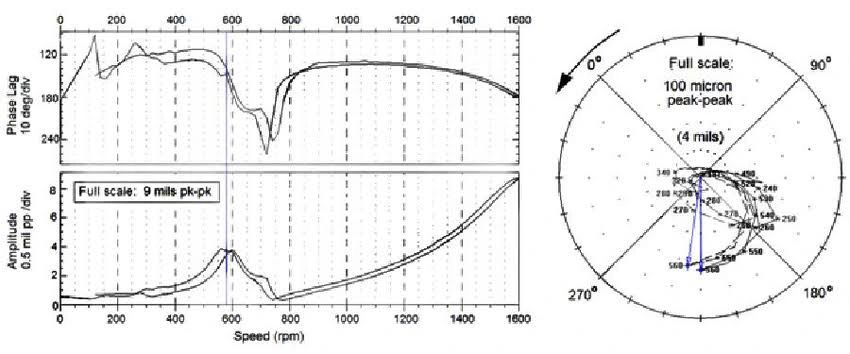
Orbit and polar plots are used to analyze rotating machinery and detect resonance. Resonance, indicated by synchronous peaks in orbit plots or amplitude peaks in polar plots, can lead to excessive vibrations and equipment damage.
1. Orbit Plots
- What are they? Orbit plots display the shaft motion of rotating machinery. They show the relative movement of the rotor in its bearings.
- **How to interpret them?** In an orbit plot, the center represents the shaft's average position. Circular orbits indicate unbalance, while elliptical orbits suggest misalignment or other issues.
- **Detecting resonance:** Look for synchronous peaks (e.g., 1X, 2X) in the orbit plot. If these coincide with natural frequencies, it indicates resonance. Adjust the system to avoid these critical speeds.
2. Polar Plots
- **What are they?** Polar plots (also known as Bode polar plots) combine amplitude and phase information. They help analyze the system's response to different frequencies.
- **How to interpret them?** The radial distance from the center represents the amplitude, while the angle represents the phase.
- **Detecting resonance:** Observe peaks in the amplitude at specific frequencies. If these match the system's natural frequencies, resonance may be occurring.
resonance can lead to excessive vibrations, reduced equipment life, and even catastrophic failures. 🚀
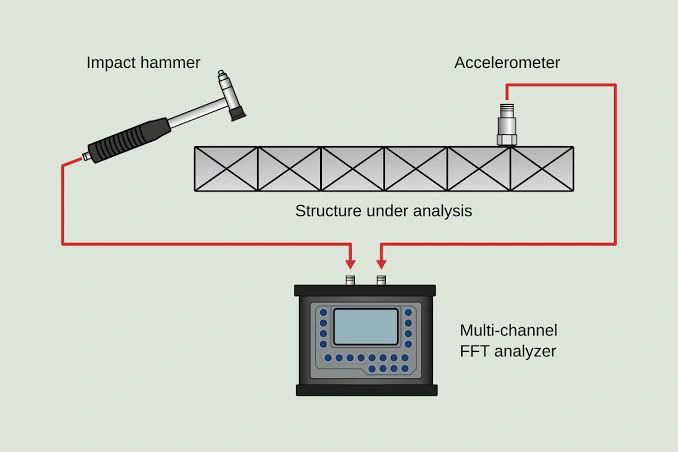
3. Impact Test for Resonance Detection:
One of the most commonly used methods for measuring a system’s natural frequency is the impact test.
Here’s how it works:
Procedure:
Strike the equipment with a mass (e.g., a hammer) and measure the response.
Impact different locations on the structure to identify all resonant frequencies.
Take both drive point and transfer point measurements.
Perform this test with the equipment off.
Outcome:
Easily identify the natural frequencies of the equipment.
Confirm resonance by comparing results from different tests.
Additional Images