Guidelines for Better Shaft Orbit Plots
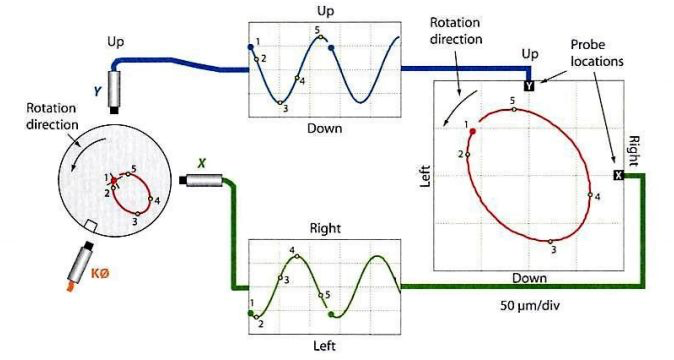
Orbit plots, created from orthogonal proximity probes and a phase reference, show shaft centerline motion during rotation. They help diagnose machine issues and set radial shaft vibration alarms based on the major axis of the elliptical orbit.
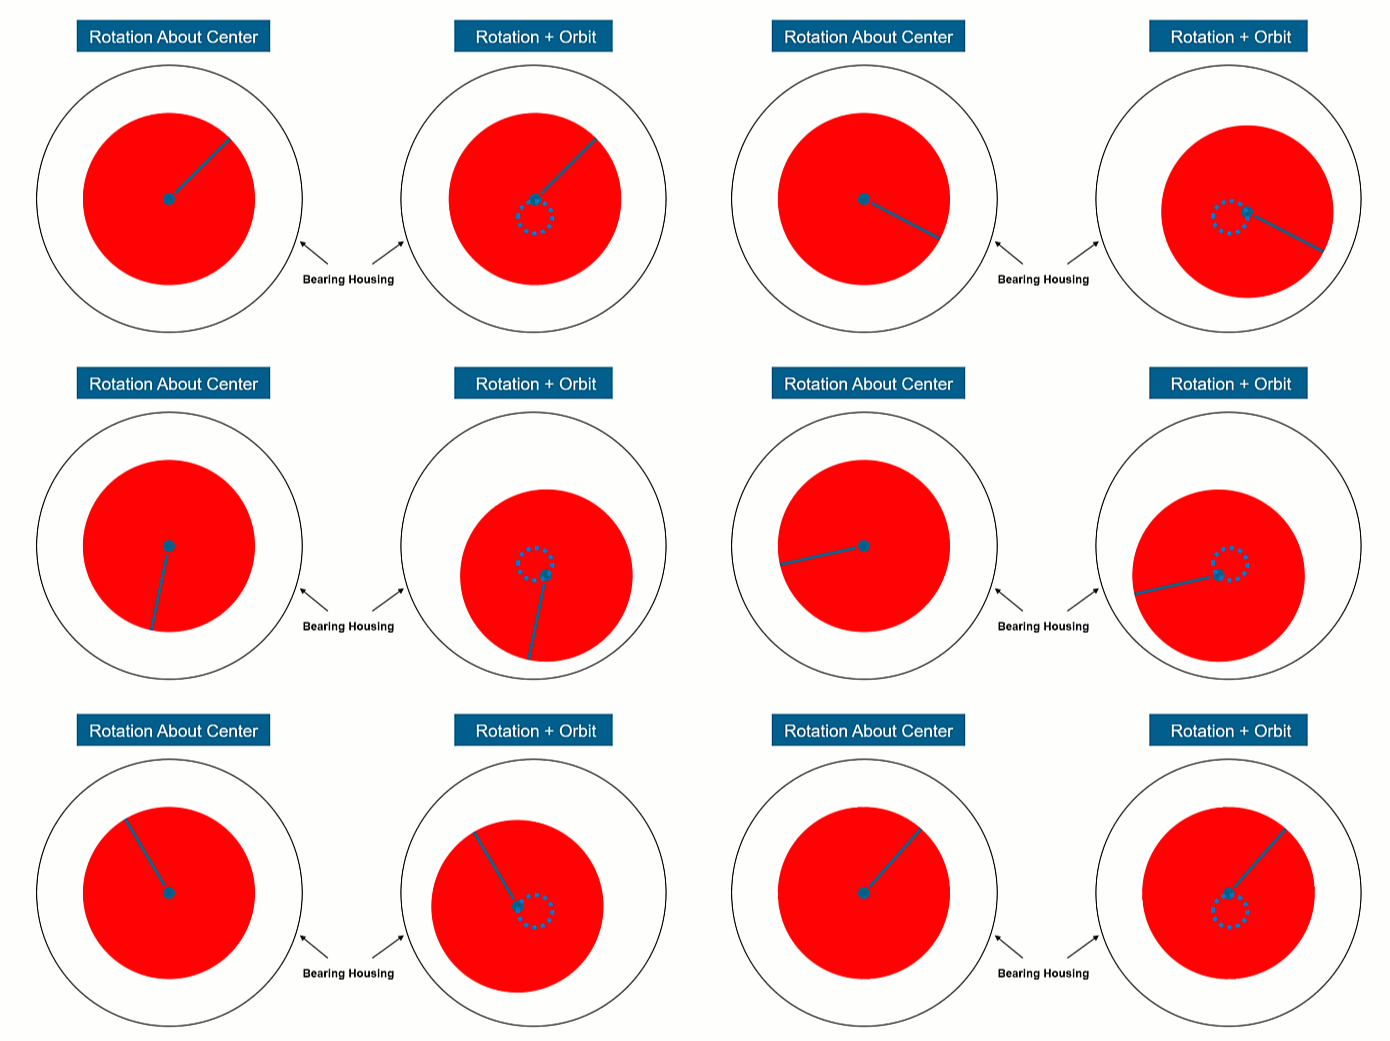
Shaft Orbit Plots: An orbit Plot shows the relative motion of the shaft centerline during one (or multiple) shaft rotations.
Orbit plots are helpful in diagnosing machine issues (unbalance, misalignment, oil instabilities).
An orbit plot is produced by combining the two orthogonal proximity probes (X, Y) and the once-per-rotation phase reference (Key phasor).
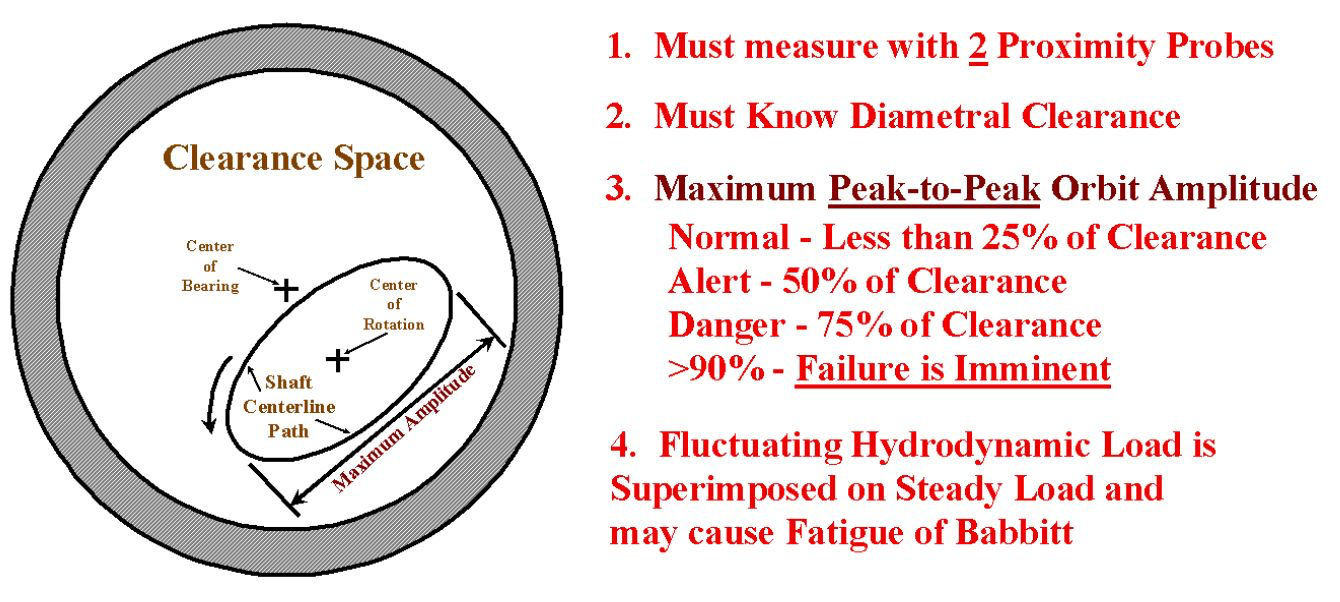
Sometimes, the maximum orbit vibration is used as the guideline for defining the radial shaft vibration alarm and shutdown level. As the orbit is usually elliptical in shape, the major axis of the ellipse (Smax) is used to set the maximum orbit vibration.
Additional Images