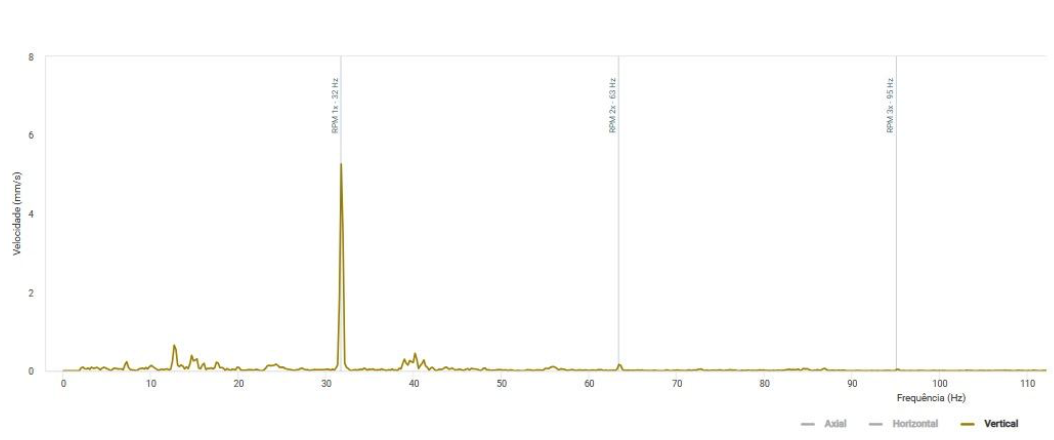
Circular Plot for Imbalance Prediction
When analyzing the circular waveform, we clearly perceive the imbalance in the equipment. Technologies evolve and help the work of the technician.
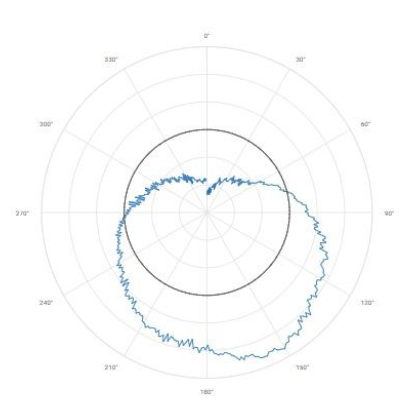
When analyzing the circular waveform, we clearly perceive the imbalance in the equipment.
A circular plot, often used in vibration analysis, is a graphical representation where the amplitude and phase of vibration signals are plotted in a polar coordinate system. This allows technicians to visualize rotational dynamics and detect issues such as unbalance, misalignment, or looseness in rotating machinery. The shape and size of the plot provide insights into the nature and severity of the fault.
As technologies continue to evolve, advanced tools and software enhance the ability of technicians to diagnose and resolve mechanical issues more efficiently, improving equipment reliability and minimizing downtime.
Additional Images