𝗗𝗲𝗰𝗼𝗻𝘀𝘁𝗿𝘂𝗰𝘁𝗶𝗻𝗴 𝗧𝗶𝗺𝗲: 𝗧𝗵𝗲 𝗣𝗿𝗼𝗽𝗵𝗲𝘁 𝘃𝘀. 𝗧𝗵𝗲 𝗠𝘂𝘀𝗶𝗰𝗶𝗮𝗻
Time series plots reveal past events, and two approaches can be used to interpret them: the Time Domain, focusing on sequence and causality, and the Frequency Domain, focusing on hidden rhythms and frequencies. Additionally, one can choose between a rigid (Parametric) or complex (Non-Parametric) structure for analysis.
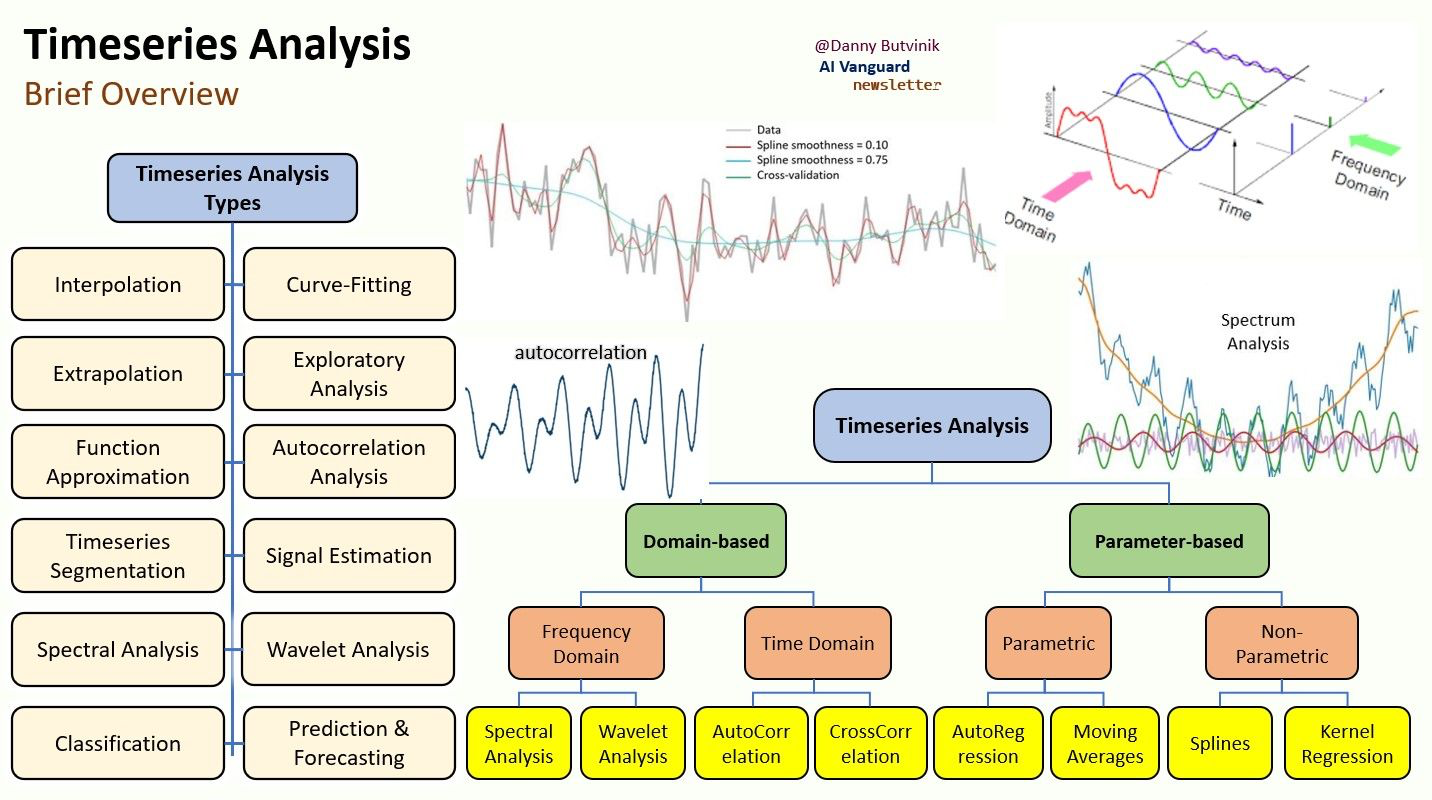
Every time series plot is a ghost story. It's the faint, noisy signal of what just happened, and our entire job is to decipher what the ghost is trying to tell us about the future. This map isn't just a list of tools; it's a guide to the two fundamentally different ways we can listen.
On one side, you have the 𝗧𝗶𝗺𝗲 𝗗𝗼𝗺𝗮𝗶𝗻 mindset. This is the approach of the prophet, obsessed with sequence and causality. It asks, "What happened just before this point? And the point before that?" It uses tools like Autocorrelation to search for echoes of the immediate past, believing the future is an extension of recent momentum. It walks along the timeline, one step at a time, trying to predict the next footfall.
On the other side is the 𝗙𝗿𝗲𝗾𝘂𝗲𝗻𝗰𝘆 𝗗𝗼𝗺𝗮𝗶𝗻. This is the mindset of the musician. The musician doesn't care about the next single note. They listen to the entire composition at once, trying to hear the hidden rhythms, the deep, underlying frequencies that repeat every day, every week, every season.
They use 𝑺𝒑𝒆𝒄𝒕𝒓𝒂𝒍 𝑨𝒏𝒂𝒍𝒚𝒔𝒊𝒔 to decompose the static and noise into a clean symphony of sine waves—the hidden pulse of the system.
And layered on top is another choice: do you impose a rigid structure on the world (Parametric) or do you let the data draw its own, more complex shape (Non-Parametric)?
We often get lost in the weeds of 𝐴𝑅𝐼𝑀𝐴 𝑣𝑠. 𝑆𝑝𝑙𝑖𝑛𝑒𝑠, but this chart is a great reminder of the bigger picture.
To truly understand a time series, you have to be both the prophet who sees the path and the musician who hears the song.